Page web2 modèles participants
Create an interactive analytics dashboard for jci specifically for cybersecurity under hct chapter aimed at surveyors. I Prompt du projet
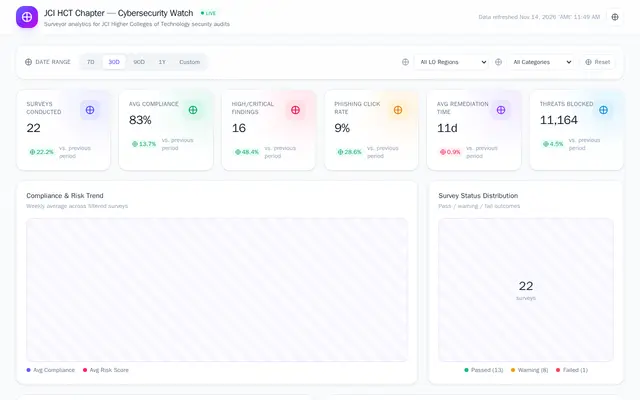
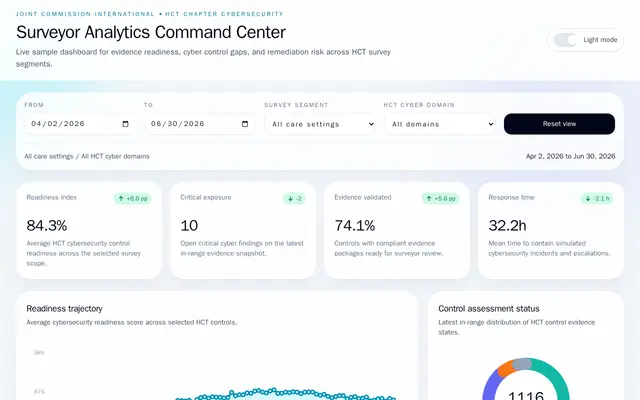
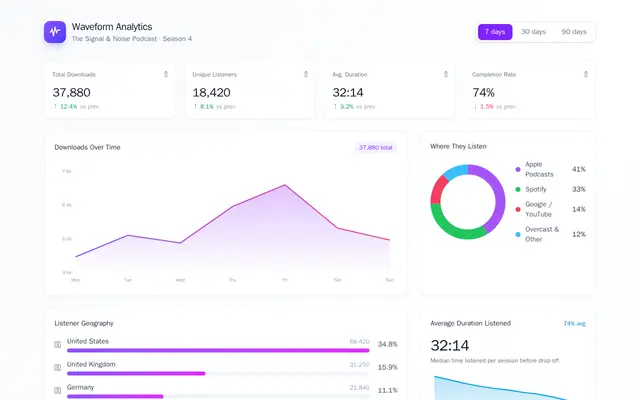
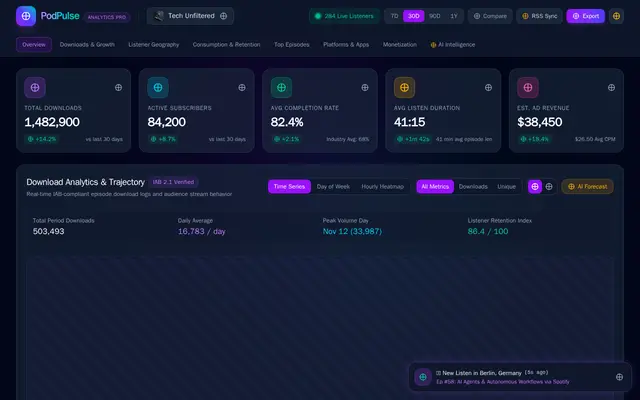
Create an interactive analytics dashboard for jci specifically for cybersecurity under hct chapter aimed at surveyors. Include KPI summary cards with trend indicators, a mix of line, bar, and donut charts with hover tooltips and smooth transitions, a sortable and filterable data table, and date-range and segment filters that update every view live. Use a clean, modern visual style with clear layout hierarchy and a dark mode toggle, generate realistic sample data so every chart feels alive, and make it fully responsive.
Aperçu